
So, less educated drivers cause more road accidents? Think again.
Let’s accept it. Most of the educated lot has this popular perception that maximum accidents are caused by drivers who are illiterate or received very less education. We think that, in general, educated people are likely to drive more cautiously, be more aware of traffic rules and would abide by them and would obviously exercise more civic sense. Sometimes this is attributed to factors dependent on education. Therefore, higher the educational qualification of a driver, lower the chance of him getting involved in a road accident. If you nodded in agreement, think again. The data on road accidents in India speaks otherwise.
As part of a capstone project for a Coursera specialization, I was required to choose a data-set, analyze it and then present the analysis through a visualization format. I select a data-set about road-accidents from http://data.gov.in. This data set provided details related to road accidents in India classified according to various parameters. In particular, I picked up the data provided on the total number of road accidents in various Indian states and Union territories (UT) along with the educational qualification of the Drivers responsible for the accidents.
The website provided data in separate JSON files (one each for each type of educational qualification) for the period of 2009-2015. The education qualification was divided in categories “Below 8th Standard” (primary school education only), “From 8 to 9 Standard” (secondary school educated) and “Above 10 Standard” (Senior secondary or Graduate/Post Graduate etc.). I discarded the data where educational qualification was not available (unknown) or accidents were not reported (zero).
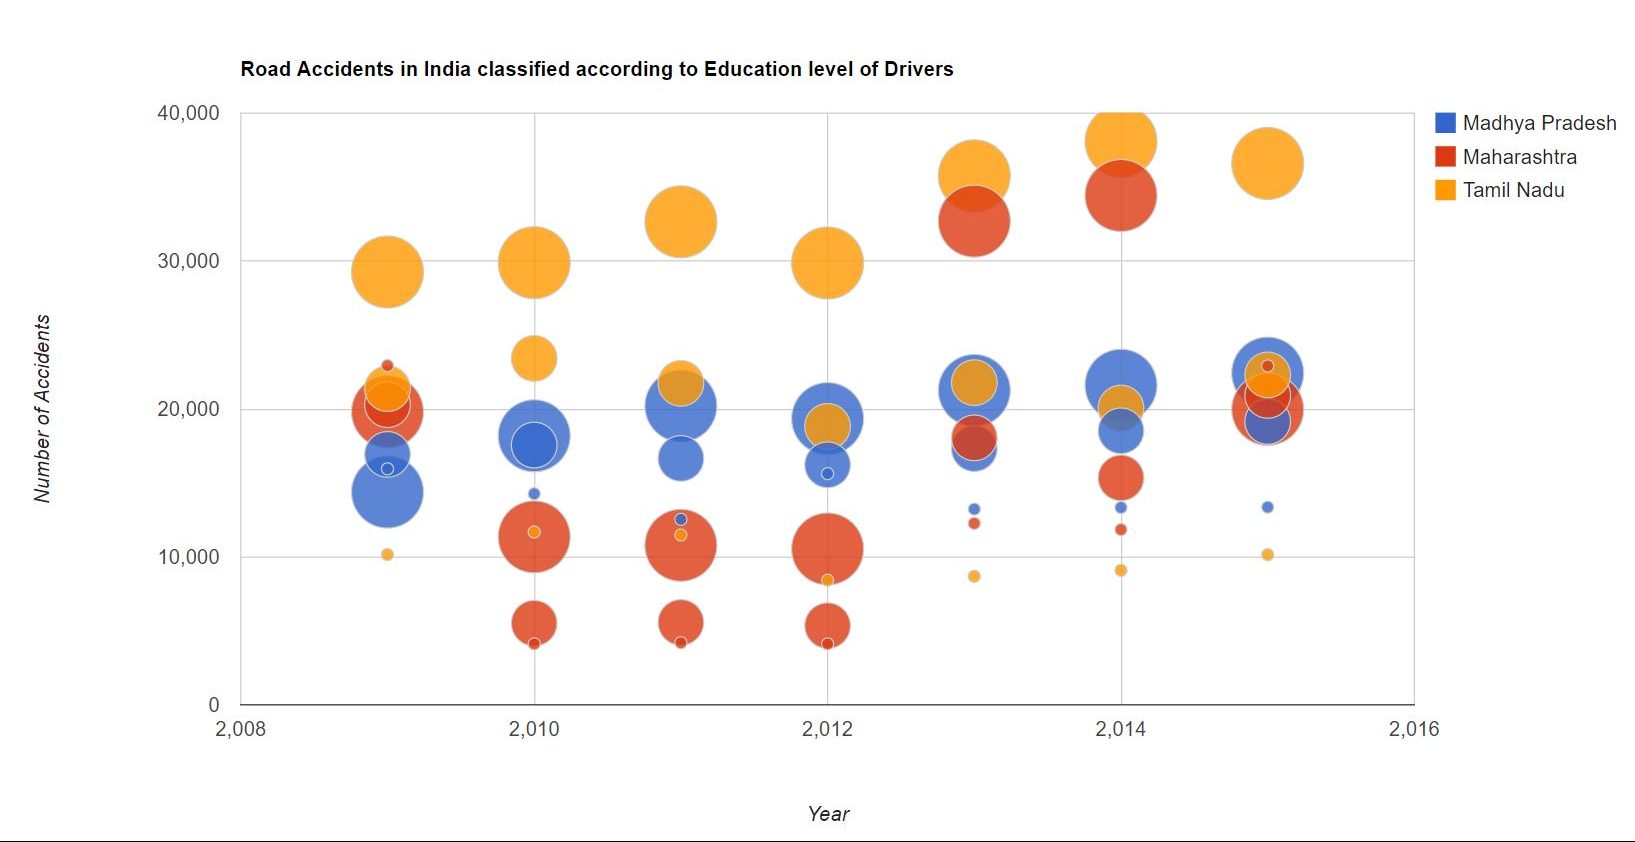
The data provided was 4 dimensional (Year of Accident, Number of Accidents, Name of State/UT where accident took place, Education Qualification of the driver). I chose to use the Google Bubble chart for visualization.
Initially, I had selected data for all 36 States/UTs and the Bubble chart (except for looking colorful) really came out too crowded to decipher anything. So I decided to focus only on the top 3 culprit states.
The Chart displays the year of accident on x-axis and number of accidents on y-axis. The bubbles are colored according to the Indian State they represent. The size of the bubble represents the educational qualification of the driver. Thus, larger the bubble size more educated was the driver.
We think that, in general, higher the educational qualification of a driver, lesser the chance of him getting involved in a road accident. The data on road accidents in India speaks otherwise.
The results of the analysis were quite an eye-opener and in fact corrected my prejudice on the subject. As we discussed earlier, a common perception is that more educated drivers are likely to cause fewer accidents. The chart shows that the reality is actually the very reverse. The accident data clearly shows that people who just received primary education (educated less than Standard 8) had caused lesser accidents than those educated higher than them, and so on. In fact, a clear pattern here is that “higher the educational qualification of the driver, more likely s/he is to cause an accident”. Of course, some may want to take away a corollary to this analysis, and infer that perhaps accidents have nothing to do with driver’s educational qualification, and that the onus should rather be placed on the driver’s driving skill.
There is more to data than the eye can see 🙂


